Nat Gas Still Look Soft in the Near Term
Three Things
The recent rally closed the Summer/Winter contango but still trades above historical norms. However, steep contango continues to send a slow-down message to producers on supply.
Henry Hub’s dependence on export economics is increasingly apparent, as is basis risk.
Storage numbers continue to offer a volatility buffer in both the US and Europe, though with ongoing regional disparity.
Summary
Winter gas continues to trade at a substantial premium to summer, despite a ~12% tightening of contango so far this week. At ~88 cents wide as of writing, the winter strip trades at a premium wider than any point during the previous five years. Not surprisingly, storage in the US is gaining on the 5-year max (more below). The EIA estimated that US NG production was up modestly during December 2022 to 99 Bcf/d compared to 98 Bcf/d during Dec 2021. During the month, consumption reached 109 Bcf/d, compared to 97 in December 2021. Consumption was higher YoY in residential use, commercial deliveries, and power burn. Industrial use was practically unchanged, down ~0.4 Bcf/d YoY.
But the importance of exports is increasingly apparent for support of the Henry Hub benchmark. Despite lower LNG exports, the US was a net gas exporter during December. To that end, Freeport’s restart has pushed US feed gas for LNG above 13.5 Bcf/d, approaching an all-time high.
Storage
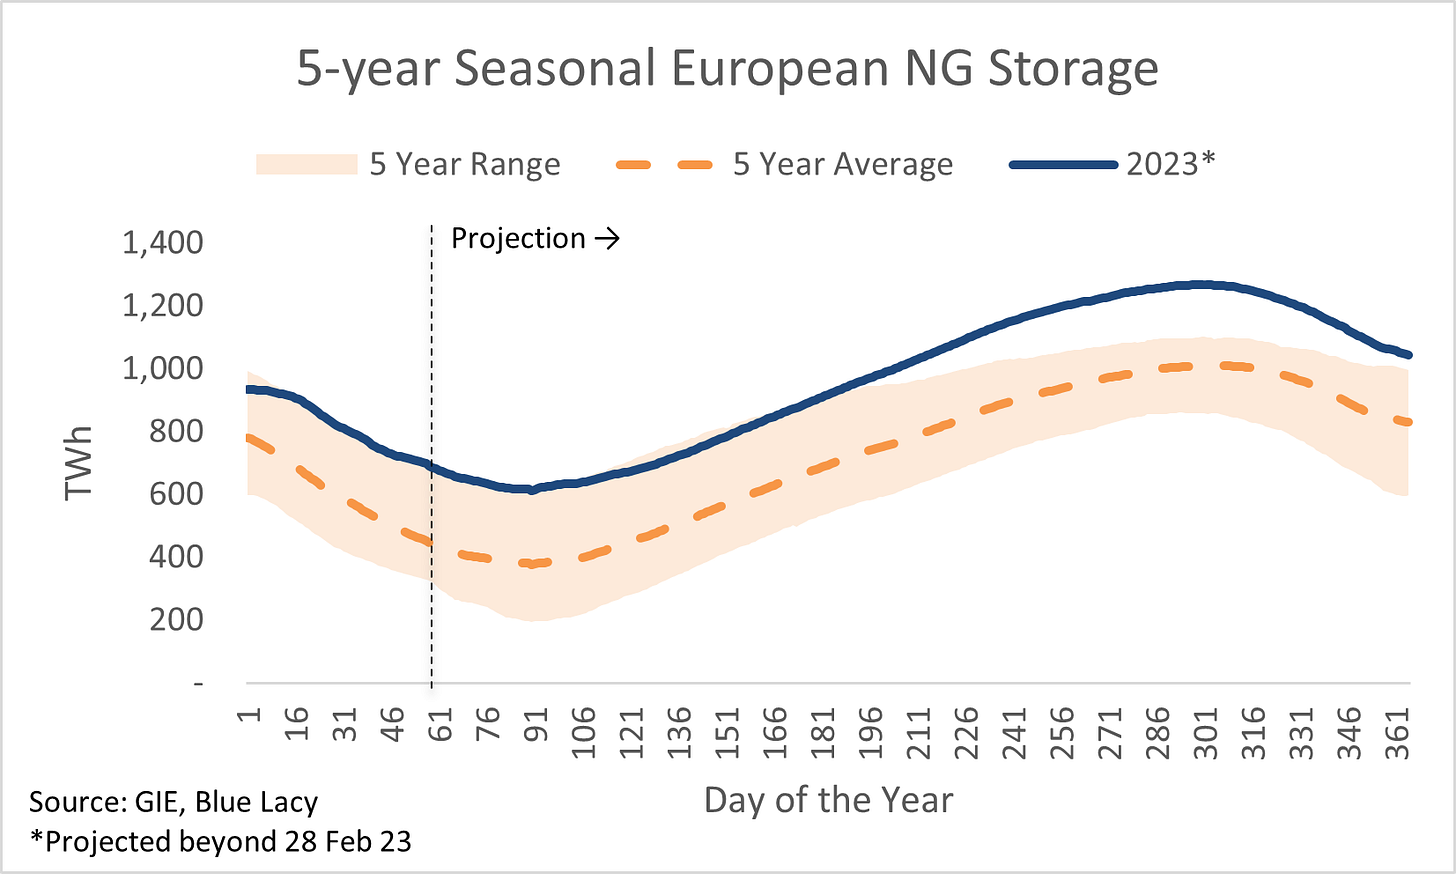
European storage dipped by just over 18 TWh through the 24 Feb 23 DOE reporting week and by a similar amount through 28 Feb 23, according to GIE. That puts total gas in storage at ~685.5 TWH at the end of Feb. Since the middle of Jan, gas in storage has traded around +/-10 TWh of the maximum level of the previous five years, set in 2020 at 695.90. With withdrawals lagging the 5-year average pace by ~52 TWh over the last two weeks, gas in storage is now in line with the end of Feb 2020 at 685.90. It is unlikely that 2023 will play out like 2020, but if 2023 matches the average of years 2016-2019 + 2021 (cherry-picking the five most recent years without the disruptions of war and pandemic), total gas in storage will consistently be at or above the 2018-2022 max.
Assuming the storage pace matches the cherry-picked “normal” pace through the end of March, gas in storage will drop to ~612, compared to the 2018-2022 max of ~617. Even with some weather-driven demand in the near-term forecast, the return of industrial demand and even a reduction in LNG send-outs may be necessary for the pace of gas storage changes to normalize during the summer injection season. That said, we may have seen a shift in the minimum level of gas carried in storage that traders consider comfortable, given the expected greater dependence on LNG. Especially considering the world has learned what market participants have long known: LNG production is unreliable. According to recent data from Kayrros, over the three years from 2020-2022, >50% of the world’s LNG capacity experienced unplanned outages of ~90 days per facility.
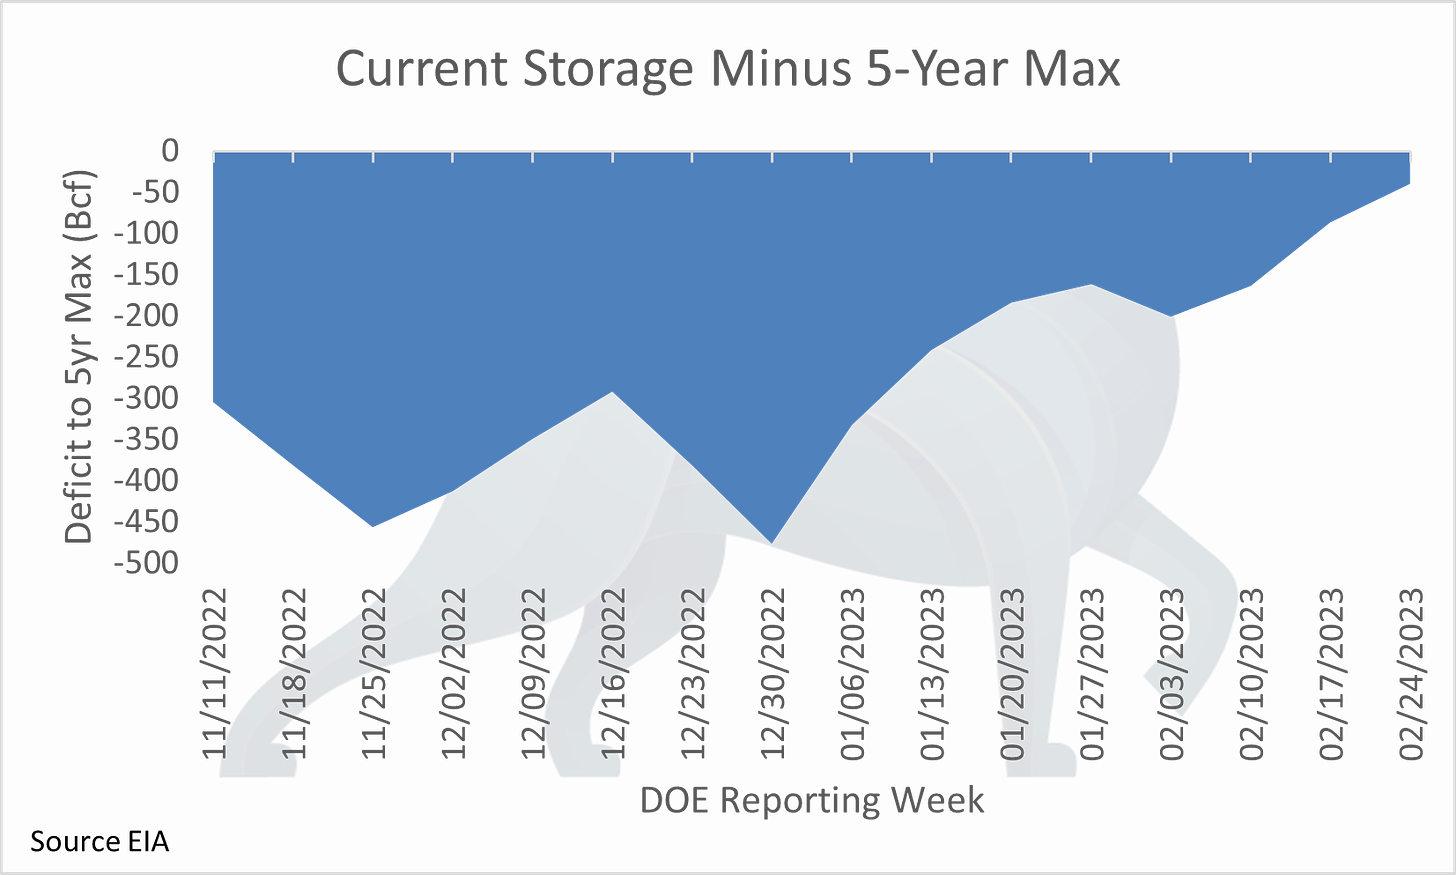
US storage saw an 81 Bcf draw for the week ending 24 Feb 23, 53 Bcf behind the 5-year average draw of 134, causing the pace of withdrawals to fall further behind. Over the last four weeks, an average of 117.25 Bcf/week was drawn compared to the 5-year average pace of 162. As with Europe, L48 US gas in storage is closer to the 5-year max of 2,153 Bcf than the average of 1,772 Bcf. With this week’s modest draw, gas in storage closed the gap to the maximum by 48 Bcf WoW and now trails the max by just 39 Bcf.
Gas in South Central storage expanded the gap above the 5-year max by 35 Bcf to 117. At 922 Bcf, gas in storage in the region is now ~115% of the 5-year max. As we’ve highlighted here in recent weeks, that is in stark contrast to the Pacific, where gas in storage fell below 100 Bcf for the first time since March of 2019. Since peaking in July of last year at 253 Bcf, gas in storage in the Pacific region has fallen 154 Bcf to 99 Bcf as of last week, ~83% of the 5-year minimum level of 119 Bcf.
Basis
April Waha closed at the week’s low of $1.345 behind the hub last night, down 24.5 cents WoW, while Dec’s discount expanded the contango in the basis curve by widening 33.75 cents, now trading >80 cents behind the hub. That means Texas and New Mexico producers have participated in just ~2/3 of the gas price rally of the last week. The market continues to tell producers in Texas and New Mexico to throttle back natural gas production, but its status as a byproduct of oil means no one hears it. Sumas basis, on the other hand, caused the net April contract to move higher at 130% of the pace of the Hub. As a result, the Sumas basis for April ended last night >22 cents wider at $0.4025 above the hub, for a net close of >$3.21 compared to ~$2.25 on 21 Feb 23, again highlighting the difference between net-import and net-export markets and differences in regional balances in the US.


